Download spatial data of census tracts of the Brazilian Population Census
Source:R/read_census_tract.R
read_census_tract.RdDownload spatial data of census tracts of the Brazilian Population Census
Usage
read_census_tract(
  code_tract,
  year = 2010,
  zone = "urban",
  simplified = TRUE,
  showProgress = TRUE,
  cache = TRUE
)
Arguments
- code_tract
The 7-digit code of a Municipality. If the two-digit code or a two-letter uppercase abbreviation of a state is passed, (e.g. 33 or "RJ") the function will load all census tracts of that state. If
code_tract="all", the function downloads all census tracts of the country.- year
Numeric. Year of the data in YYYY format. Defaults to
2010.- zone
For census tracts before 2010, 'urban' and 'rural' census tracts are separate data sets.
- simplified
Logic
FALSEorTRUE, indicating whether the function should return the data set with 'original' spatial resolution or a data set with 'simplified' geometry. Defaults toTRUE. For spatial analysis and statistics users should setsimplified = FALSE. Borders have been simplified by removing vertices of borders usingst_simplify{sf}preserving topology with adToleranceof 100.- showProgress
Logical. Defaults to
TRUEdisplay progress bar.- cache
Logical. Whether the function should read the data cached locally, which is faster. Defaults to
cache = TRUE. By default,geobrstores data files in a temporary directory that exists only within each R session. Ifcache = FALSE, the function will download the data again and overwrite the local file.
See also
Other general area functions:
read_conservation_units()
Examples
# Read rural census tracts for years before 2007
  c <- read_census_tract(code_tract=5201108, year=2000, zone="rural")
#> Using year/date 2000
#> Using data of Rural census tracts

# Read all census tracts of a state at a given year
  c <- read_census_tract(code_tract=53, year=2010) # or
#> Using year/date 2010
  c <- read_census_tract(code_tract="DF", year=2010)
#> Using year/date 2010
  plot(c)
#> Warning: plotting the first 10 out of 11 attributes; use max.plot = 11 to plot all


# Read all census tracts of a municipality at a given year
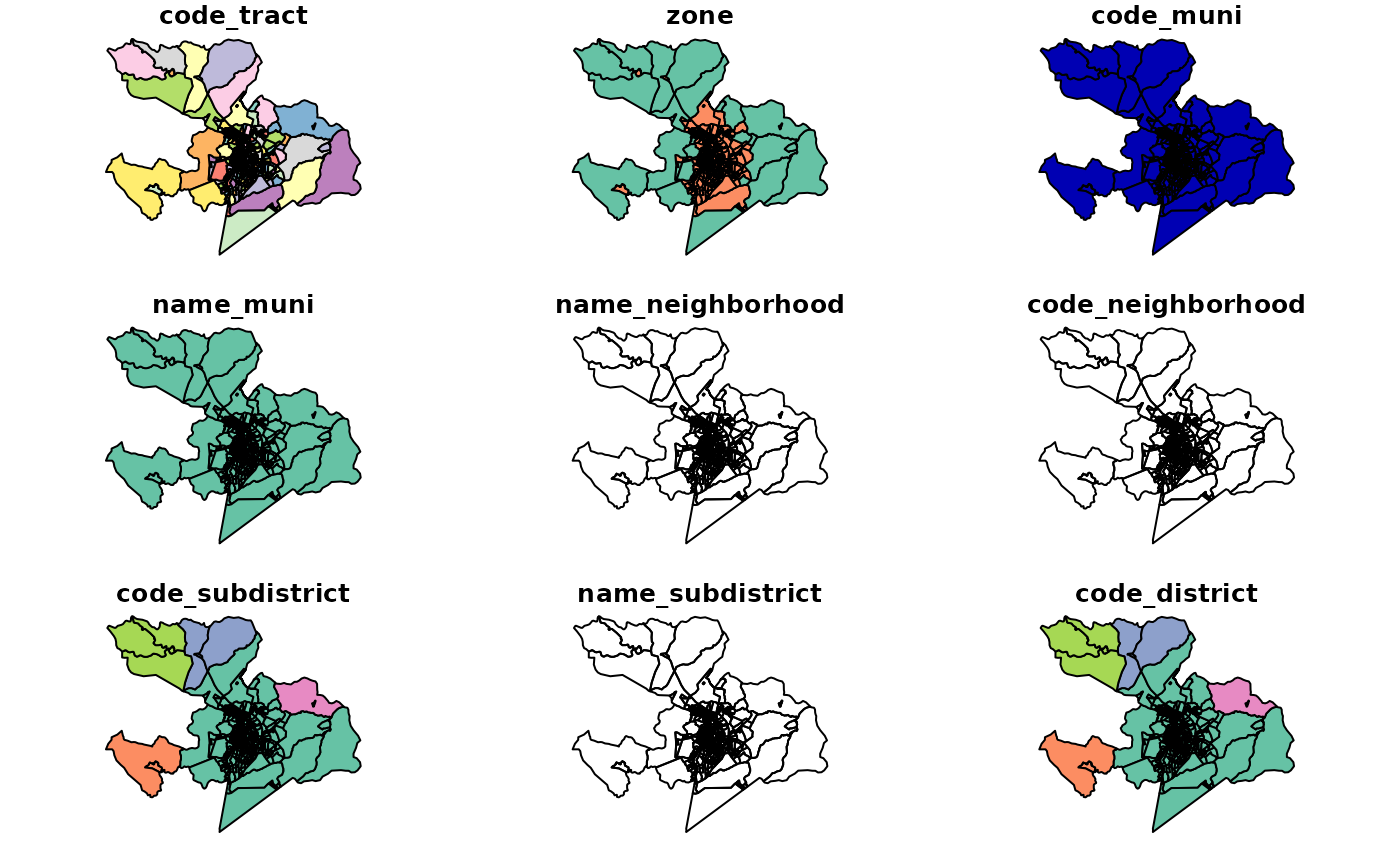
  c <- read_census_tract(code_tract=5201108, year=2010)
#> Using year/date 2010
  plot(c)
#> Warning: plotting the first 9 out of 11 attributes; use max.plot = 11 to plot all


# Read all census tracts of the country at a given year
  c <- read_census_tract(code_tract="all", year=2010)
#> Using year/date 2010
#> Loading data for the whole country. This might take a few minutes.