SECTION 5: Data from the Access to Opportunity Project
The purpose of this section is: i) to present the accessibility, land use and socioeconomic data made available by the AOP; and ii) to teach how to download and use this data with the {aopdata} R package.
In the previous chapters, we learned about the concept of accessibility, how this concept is usually translated into quantitative measures and how to estimate accessibility levels using R. However, we often come across situations in which we do not want to calculate accessibility levels ourselves, either because we do not have the resources or data required for this or simply because they have already been calculated by other people. Throughout the next chapters, we will present the accessibility database created and made available by AOP.
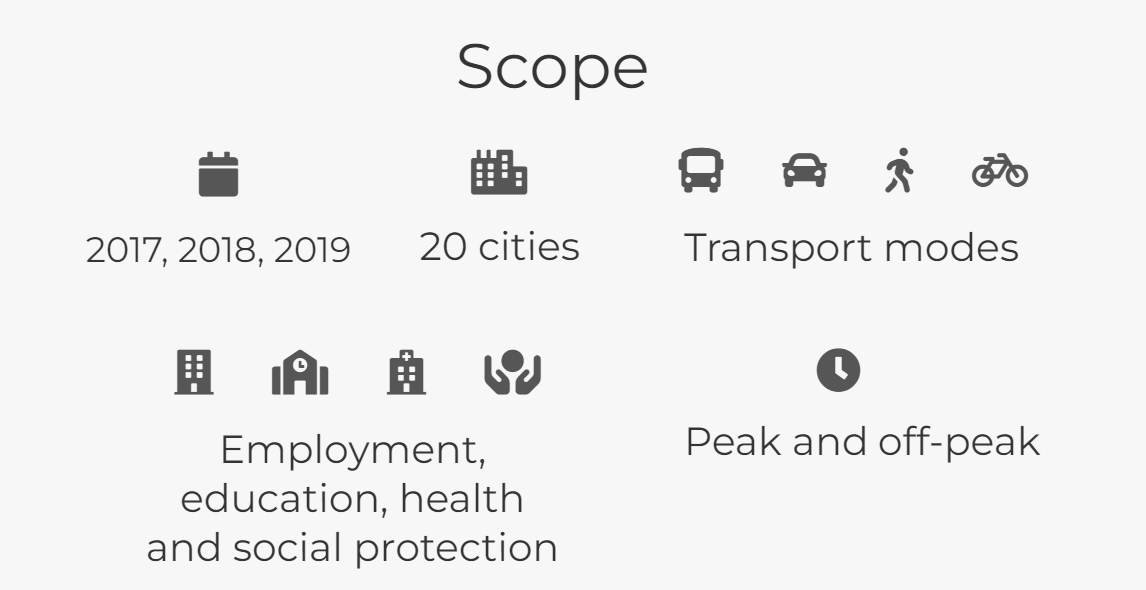
AOP is a research initiative led by Ipea with the objective of investigating the urban accessibility conditions and the inequalities in access to opportunities in Brazilian cities. All data produced by the project is made publicly available, including not only accessibility estimates, but also information on the spatial distribution of population, economic activities and public services1. The data is spatially aggregated into a hexagonal grid indexed by the H3 geospatial indexing system, originally developed by Uber (Brodsky 2018). Each hexagonal cell covers around 0.11 km², an area similar to that covered by a city block, resulting in high spatial resolution analyses and outputs. As shown in Figure 1, accessibility estimates have been produced for the years 2017, 2018 and 2019 and for the 20 largest Brazilian cities, considering different transport modes (walking, cycling, public transport and automobile), times of day (peak and off-peak), population groups (aggregated by income, race, sex and age) and types of activity (jobs, schools, health services and social assistance centers).
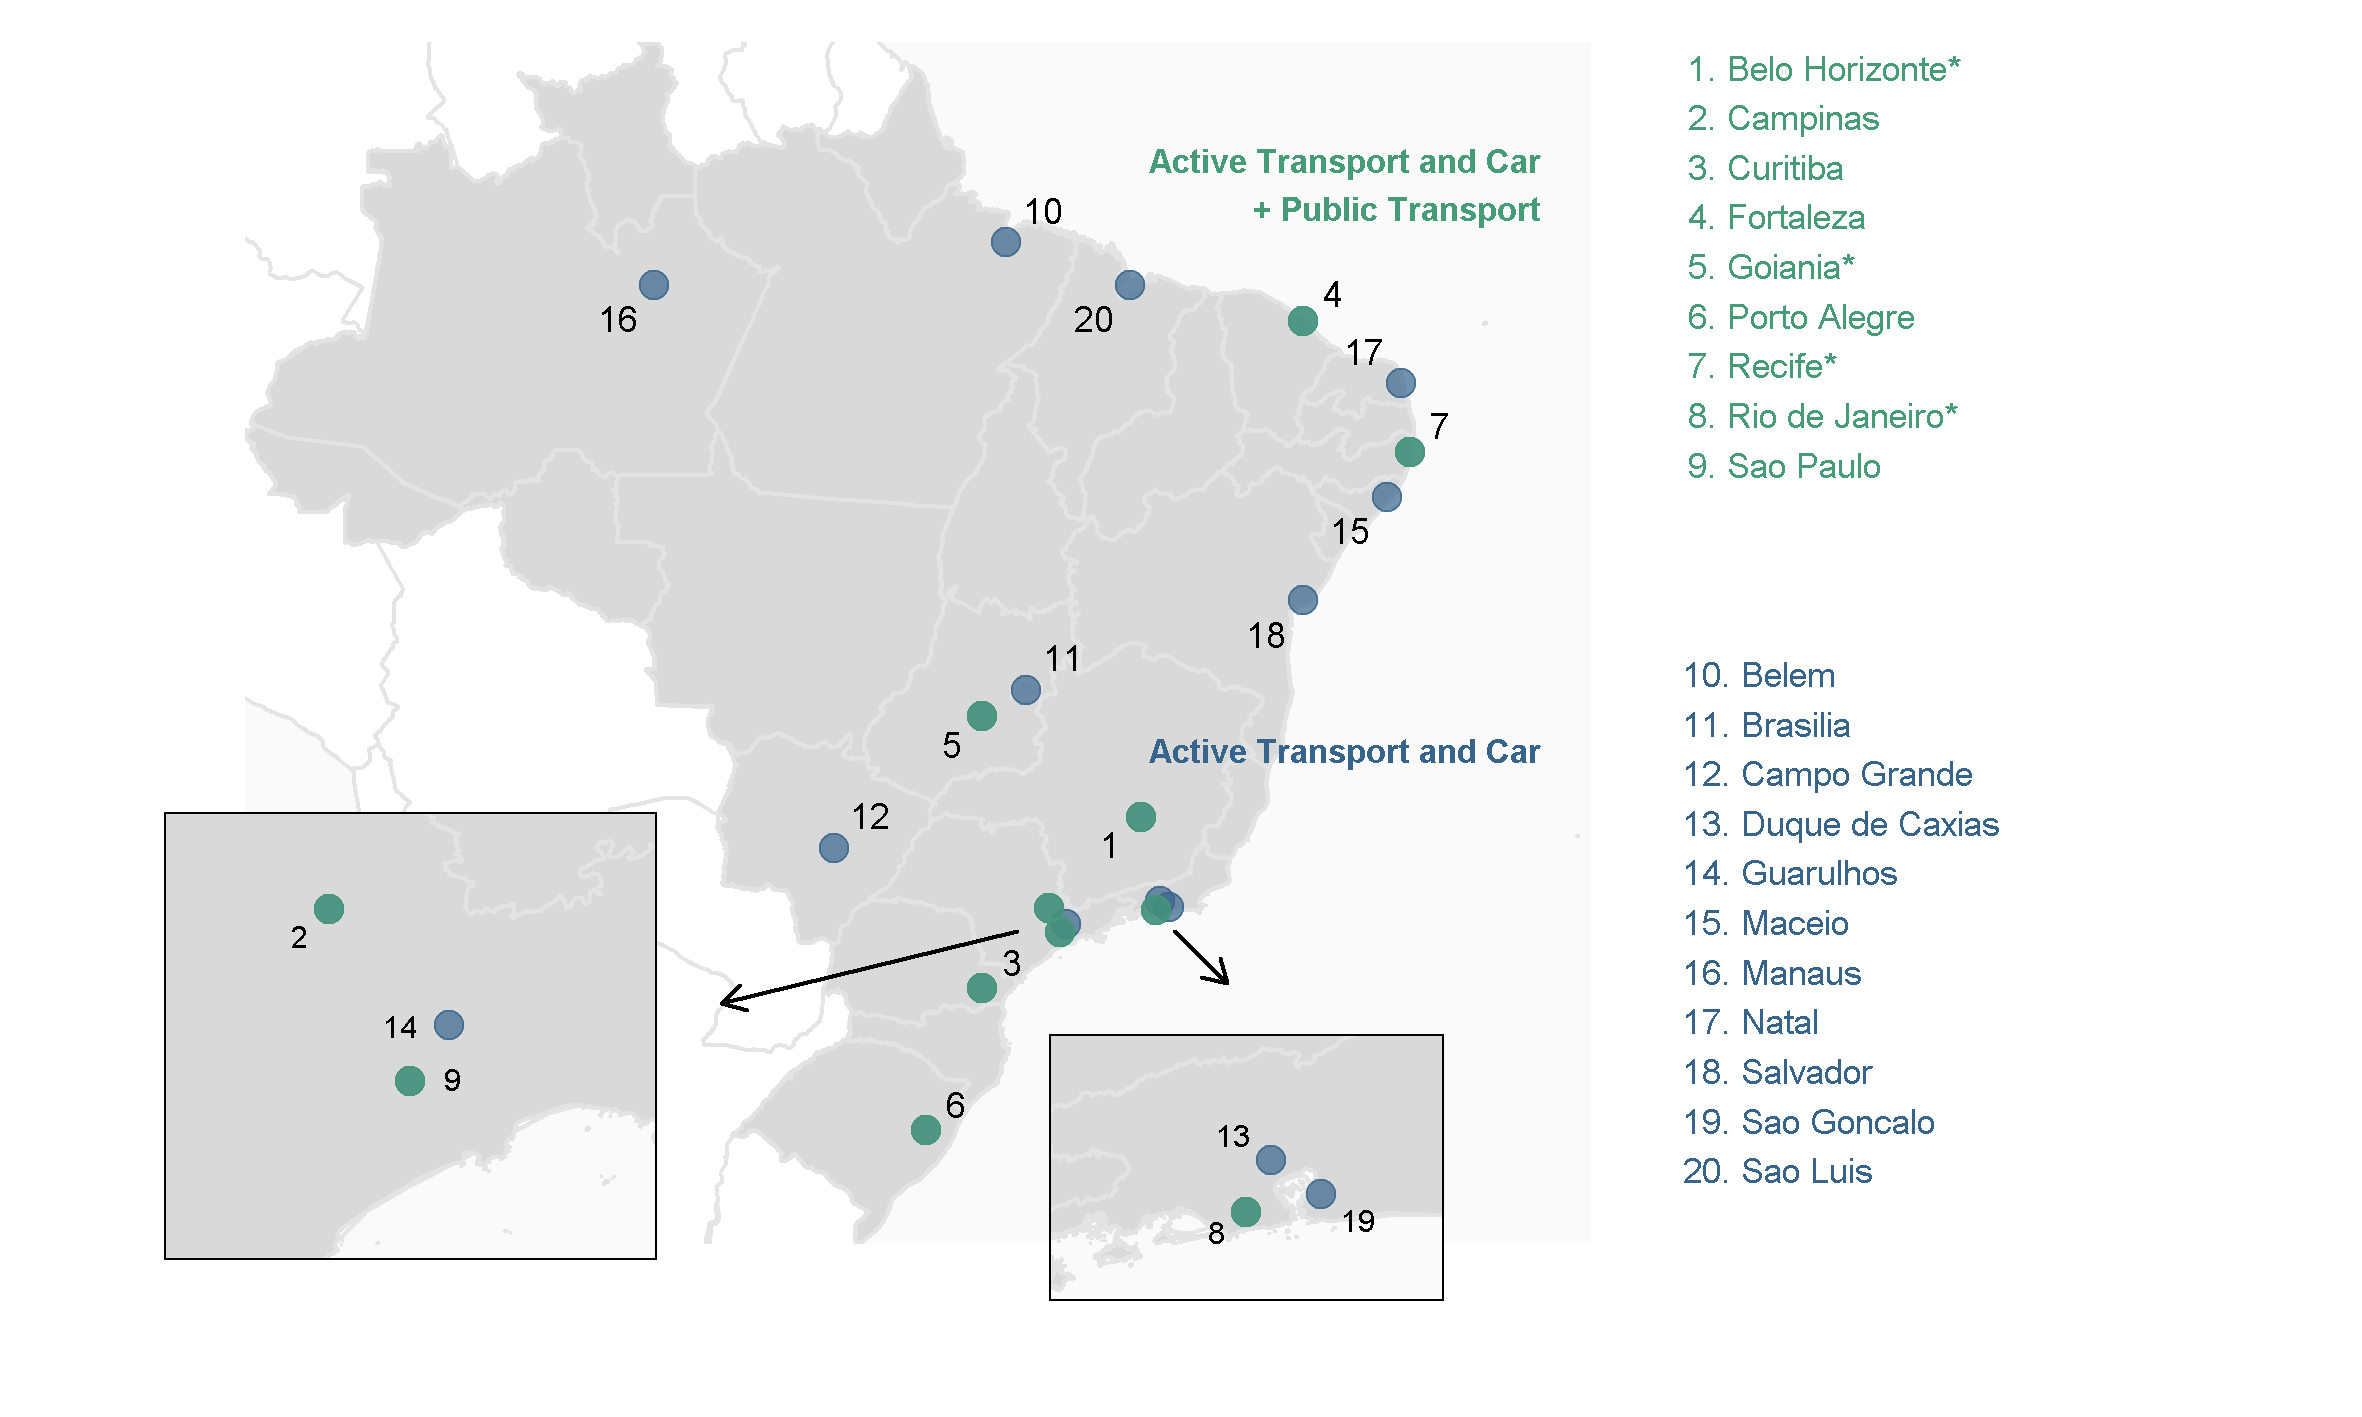
Accessibility estimates by public transport were calculated only for cities with good quality GTFS data, which include Belo Horizonte, Campinas, Curitiba, Fortaleza, Goiânia2, Porto Alegre, Recife, Rio de Janeiro and São Paulo. Still, in some cases the feeds of some of these cities were either only available for a few years or had quality issues, not being representative of the public transport operations they should be describing. In such cases, accessibility estimates by public transport were not calculated. Figure 2 shows the cities included in the project and the transport modes considered in their accessibility estimates.
The following tables summarize the data made available by the project. Table 1 describes the urban accessibility dataset.
| Indicator (code) | Description | Type of opportunities | Travel time thresholds |
|---|---|---|---|
| Minimum travel time (TMI) | Time to the nearest opportunity | Health, education and social assistance reference centers (CRAS) | Walk (60 minutes); bicycle, public transport and car (120 minutes) |
| Active cumulative accessibility measure (CMA) | Number of accessible opportunities within a given travel time threshold | Jobs, health, education and CRAS | Walk and bicycle (15, 30, 45 and 60 minutes); public transport and car (15, 30, 60, 90 and 120 minutes) |
| Passive cumulative accessibility measure (CMP) | Number of people that can access the grid cell within a given travel time threshold | - | Walk and bicycle (15, 30, 45 and 60 minutes); public transport and car (15, 30, 60, 90 and 120 minutes) |
Table 2 describes the dataset containing the sociodemographic characteristics of the population and the spatial distribution of opportunities.
| Data | Information | Years | Source |
|---|---|---|---|
| Sociodemographic characteristics of the population | Number of people by sex, age and race; average income per capita | 2010 | Demographic Census from the Brazilian Institute for Geography and Statistics (IBGE) |
| Education services | Number of public schools by education level (early childhood, primary and secondary education) | 2017, 2018, 2019 | School Census from the Anísio Teixeira National Institute for Educational Studies and Research (Inep) |
| Health services | Number of health facilities that serve the Unified Health System (SUS) by complexity level (low, medium and high complexity) | 2017, 2018, 2019 | National Registry of Health Facilities (CNES) from the Ministry of Health |
| Economic activity | Number of formal jobs by education level of workers (primary, secondary and tertiary education) | 2017, 2018, 2019 | Annual Relation of Social Information (RAIS) from the Ministry of Economy |
| Social welfare services | Number of CRAS | 2017, 2018, 2019 | Unified Social Assistance System (SUAS) Census from the Ministry of Citizenship |
All datasets created by AOP are available for download in the project website and through the {aopdata} R package. The data dictionary can be accessed online3 or with the command aopdata::aopdata_dictionary(lang = "en") in an R session. The chapters in this section provide several examples illustrating how to download the datasets and create visualizations with them in R.
The methods used to generate these datasets are presented in detail in two separate publications, one for population and land use data (Pereira, Herszenhut, et al. 2022) and another for accessibility data (Pereira, Braga, et al. 2022).↩︎
Goiânia’s GTFS covers not only the municipality, but its entire metropolitan region.↩︎
Available at https://ipeagit.github.io/aopdata/articles/data_dic_en.html.↩︎